With the Google Maps extension, you can create Google Maps mashups easily. You can generate a report object with a Google Map with markers placed on the map. The marker's speech bubble can contain your own data. Placement of the pins can be done by using location data (latitude & longitude) or simply pass the address on as a location.
Maps attributes: size, center, and zoom value can be controlled with parameters. If no map attributes are given, the default size of the map is used. The map is centered using markers and automatic zooming is done to fit the markers into the map.
Commands
dbr.googlemaps - Display Google Maps mashupdbr.googlemaps.heatmap - Use Google Maps Heatmap layerdbr.googlemaps.link_in_title - Whether to show single linked report in the title or in the markerdbr.googlemaps.polyline - Draw a polyline between the pointsdbr.googlemaps.route - Draw route between the pointsdbr.googlemaps.kml - Include KML-file into the mapsdbr.googlemaps.geojson - Include GeoJSON-file into the mapsdbr.googlemaps.marker - Add additional markers to mapdbr.googlemaps.same - Use the previous map and add elements to it instead of creating a new one
Syntax
select 'dbr.googlemaps', 'coordinates' | 'address' [, title [, width [, height [, lat [ , lng [, zoom [, map_type]]]]]]]
select 'dbr.googlemaps.heatmap', 1[, 'HeatmapLayerOptionsJSON}'
select 'dbr.googlemaps.link_in_title', 1
select 'dbr.googlemaps.polyline', color, width
select 'dbr.googlemaps.route', 'driving' | 'walking' | 'bicycling' | 'transit' | two_wheeler, [ hide_markers, [ avoid]]
select 'dbr.googlemaps.kml', url_to_kml_file
select 'dbr.googlemaps.geojson', url_to_geojson_file
select 'dbr.googlemaps.marker', lat | address [, lng [, bubble [, icon [, iconShadow [, markerLabel]]]]]
select 'dbr.googlemaps.marker', lat | address [, lng [, bubble [, icon [, iconShadow [, markerLabel]]]]]
Using address:
select address, bubble_html [, marker [, shadow[, marker_label }} }
Using latitude/longitude:
select latitude, longitude, bubble_html [, marker [, shadow[, marker_label } } }
Using latitude/longitude-based heatmap (faster):
select latitude, longitude [, PointWeight] }
Using address-based heatmap (slower):
select address [, PointWeight] }
Where:
- lat, lng
- latitude and longitude of the map center, use 0 to autocenter
- map_type
- 'roadmap', 'satellite', 'terrain' or 'hybrid'
- bubble
- Can be anything from these:
- marker-{Google Maps PinElement as JSON}
- svg-marker-background_color-glyph_color-border_color
- predefined marker See the options
- URL to an image Accessible image URL
- SVG image source <svg>...</svg>
- marker/shadow
- The optional 'marker' and 'shadow' are a URL to pictures to be shown on the map. myDBR comes preinstalled with some of the common markers, but you can also use your own pictures as markers. If you are using your own pictures the format is 'URL::x::y[::center]' where the x and y represent the size of the picture in pixels and optional center parameter centers the marker.
- HeatmapLayerOptions
- Optional Google Maps HeatmapLayerOptions as JavaScript object literals like "dissipating:false,radius:2"
- PointWeight
- The PointWeight object allows you to additionally specify a weight for that data point. Applying a weight to a data point will cause the PointWeight to be rendered with greater intensity.
myDBR Google Maps extension uses Google Maps API V3 and when addresses are used it uses server-side geocoding. If you have a Google Maps API key, you can use it in by adding the following line into it:
$mydbr_defaults['google_maps_api_key']='YOUR_API_KEY';
/* Mashup based on address */
select 'dbr.googlemaps', 'address';

select address, bubble_html
from mydb.data;

/* Mashup based on coordinates */
select 'dbr.googlemaps', 'coordinates';

select latitude, longitude, bubble_html
from mydb.data;
The command allows you to generate a Google Maps mashup (map, markers on the map, and the bubble). The command has two variations of input, one with coordinated (latitude and longitude) and one with the address based placing the marker.
Report place markers on a map based on their latitude and longitude.
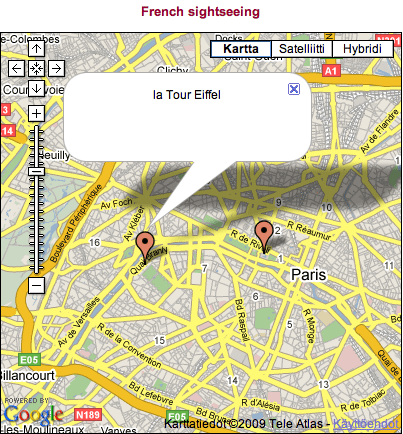
/* We'll zoom the map to Paris */
select 'dbr.googlemaps', 'coordinates', 'French sightseeing', 400, 400;

select 48.858863, 2.294362, 'la Tour Eiffel'
union
select 48.861397, 2.335432, 'Musee du Louvre';
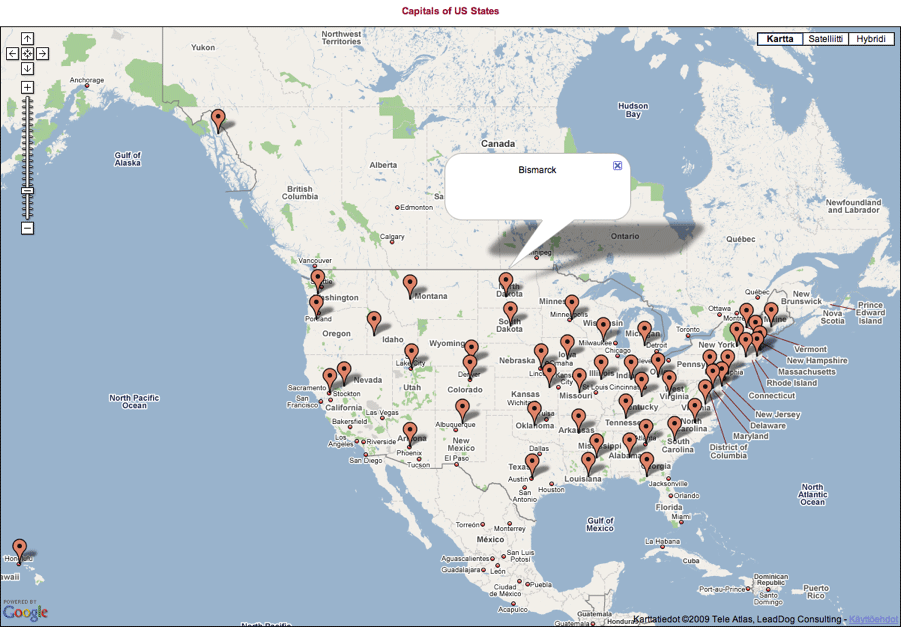
Report place markers on a map based on their address. Using address is quite flexible in Google Maps so we can just place the names we're looking for. This will produce the same result as the example above. The first column is used as the search criteria and the second one is used in the bubbles.
/* Center to US */
select 'dbr.googlemaps', 'address', 'Capitals of US States', 1200, 800;

select concat(state, ',', capital), capital
from mydb.us_states;
myDBR comes with a set of preinstalled markers.
Here is the list of preinstalled markers and the URL to be used. With preinstalled markers, myDBR automatically knows the size of the maker and applies the appropriate shadow to it.
| Plain | URL | Dot | URL | Pushpin | URL |
|---|---|---|---|---|---|
| blue |
|
blue-dot |
|
blue-pushpin | |
|
|
green |
|
green-dot |
|
grn-pushpin |
|
|
pink |
|
pink-dot |
|
pink-pushpin |
|
|
purple |
|
purple-dot |
|
purple-pushpin |
|
|
red |
|
red-dot |
|
red-pushpin |
|
|
yellow |
|
yellow-dot |
|
ylw-pushpin |
|
|
orange |
|
orange-dot |
|
marker-Google Maps PinElement as JSON |
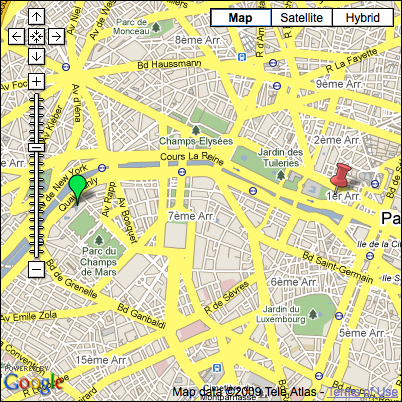
select 'dbr.googlemaps', 'address', 'French sightseeing', 400, 400;

select 'la Tour Eiffel', 'la Tour Eiffel', 'green'
union
select 'Musee du Louvre', 'Musee du Louvre', 'red-pushpin';
union
select 'Musee Bourdelle, Paris', 'Musee Bourdelle', '<svg....>'
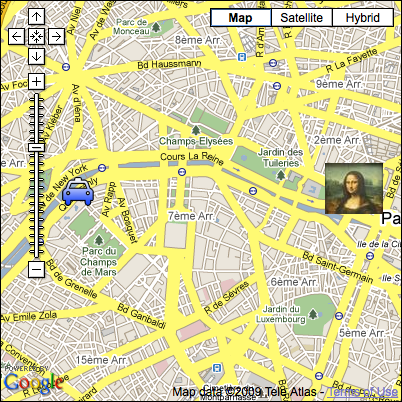
You can also use images as markers with myDBR. To do this you need to provide the URL and optinally the desired size of the image (using '::width::height' notation at the end of URL).
select 'dbr.googlemaps', 'address', 'French sightseeing', 400, 400;

select 'la Tour Eiffel', 'la Tour Eiffel', 'http://maps.google.com/mapfiles/ms/micons/cabs.png::32::32'
union
select 'Musee du Louvre', 'Musee du Louvre', '/myimages/monalisa.jpg::58::51';
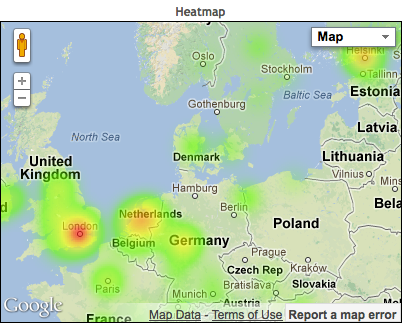
select 'dbr.googlemaps', 'coordinates';
select 'dbr.googlemaps.heatmap', 1;

select latitude, longitude
from mydata;

select 'dbr.googlemaps', 'coordinates';
select 'dbr.googlemaps.heatmap', 1, '{"radius":20;"dissipating":false;}';

select latitude, longitude, weight
from mydata;
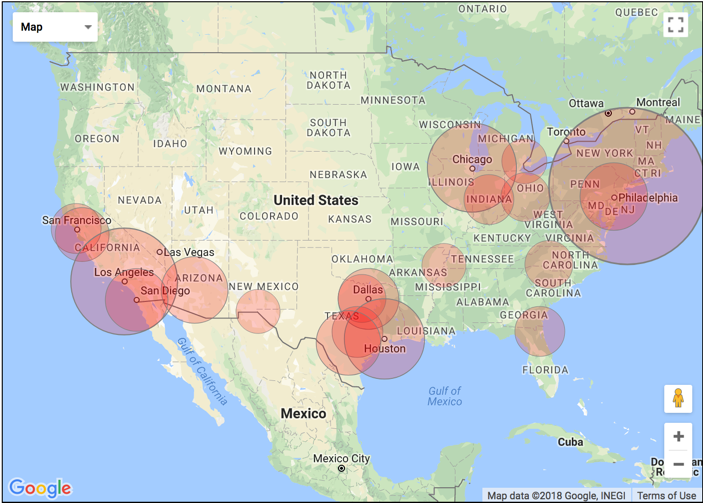
You can use custom SVG markers in Google Maps by adding an SVG chart as a marker parameter.
Define the SVG image you wish to use as a marker:
<?xml version="1.0" encoding="UTF-8" standalone="no"?>
<svg xmlns="http://www.w3.org/2000/svg" width="100" height="100">
<circle cx="50" cy="50" r="49" fill="red" fill-opacity="0.2" stroke="gray" stroke-width="1"/>
</svg>
select 'dbr.parameters.show';
select 'dbr.googlemaps', 'coordinates', 'Biggest cities in US', 700, 500;

select latitude, longitude, name, f_map_city_size(''user/images/circle.svg', population), '','', population
from us_cities
order by population desc;
where the f_map_city_size-function returns the size (in pixels) of the SVG image relative to population. For example: "user/images/circle.svg::160::160::center".
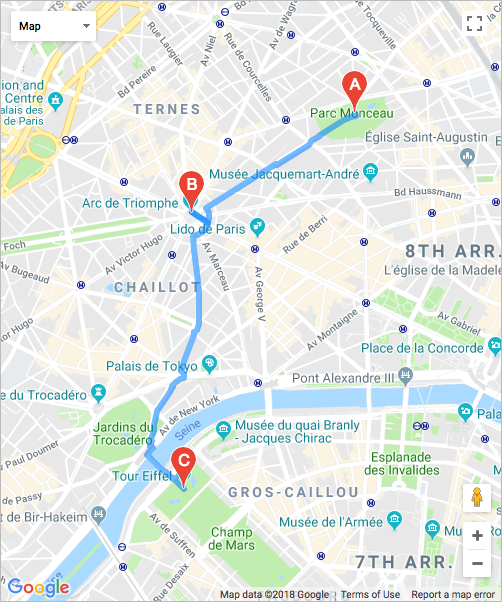
The route option allows for route planning. If you add an additional color column as last column into the query, you can define the route color and have multiple routes. The avoid parameter is a comma separated string for means to avoid ('ferries,highways,tolls').
select 'dbr.googlemaps', 'address', '', 500, 600;
select 'dbr.googlemaps.route', 'walking';

select 'Parc Monceau, Paris'
union
select 'Arc de Triomphe'
union
select 'Eiffel tower';
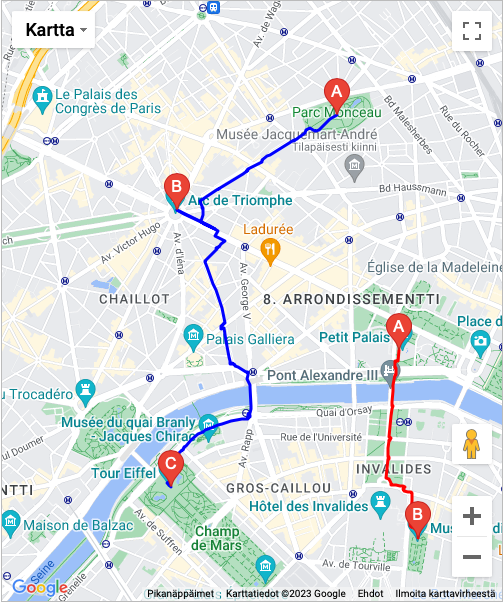
select 'dbr.googlemaps', 'address', '', 500, 600;
select 'dbr.googlemaps.route', 'walking';

select 'Parc Monceau, Paris', 'blue'
union
select 'Arc de Triomphe', 'blue'
union
select 'Eiffel tower', 'blue'
union
select 'Petit Palais', 'red'
union
select 'Musée Rodin', 'red';
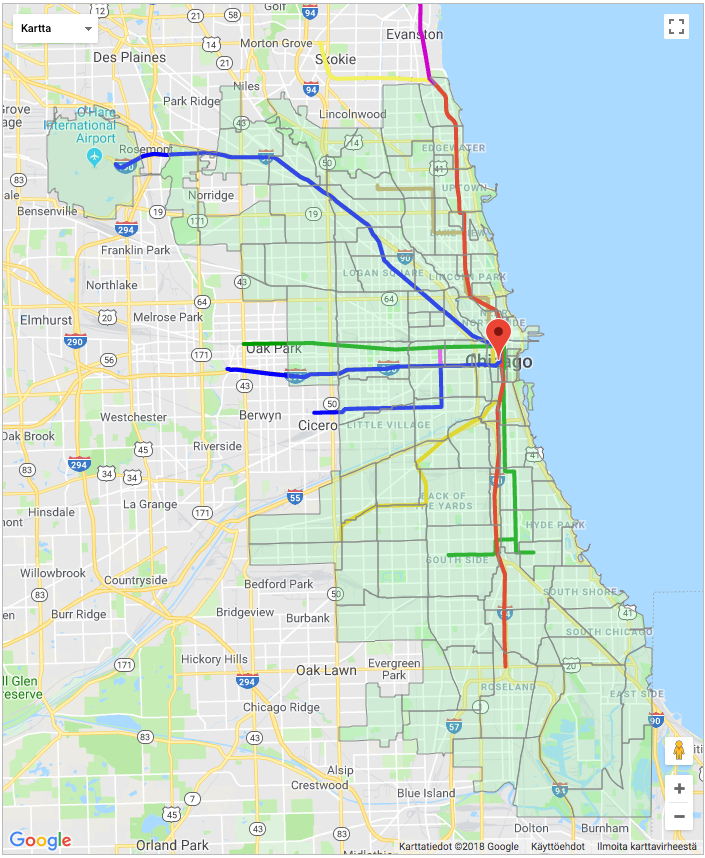
You can also include a KML and GeoJSON files to the map and access the Google Maps API in your report to further extend the map functionality
The Google_map.get_map_object-function can be used to get the Google Maps object. The function takes a resultclass as a parameter.
select 'dbr.resultclass', 'sample_map';
select 'dbr.googlemaps', 'coordinates', '', 700, 850, 0, 0, 9;
select 'dbr.googlemaps.kml', 'http://googlemaps.github.io/js-v2-samples/ggeoxml/cta.kml';
select 'dbr.googlemaps.geojson', 'user/chicago.geojson';

select 'Chicago';

select 'dbr.javascript', "Google_map.get_map_object('sample_map').data.setStyle([fillColor: '#94F2AC',strokeColor:'#888' ,strokeWeight: 1});";
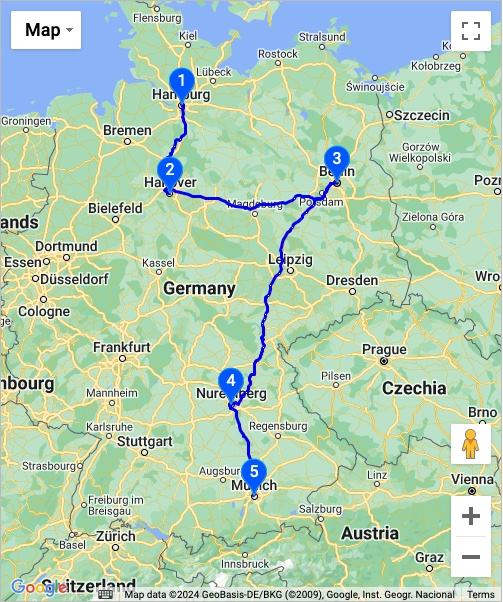
Using dbr.googlemaps.same-command, a subsequent map content will be added to the currrent map instead of creating a new map. In the example, a route is first created without markers and then custom markers are added to the map:
create temporary table stops
as
select 'Hamburg' as 'name', 1 as label
union
select 'Hannover', 2
union
select 'Berlin', 3
union
select 'Nürnberg', 4
union
select 'München', 5;


select 'dbr.googlemaps', 'address', '', 500, 600;
select 'dbr.googlemaps.route', 'driving', 0;

select name
from stops
order by label;

/* Add elements to the previuous map */
select 'dbr.googlemaps.same', 1;
select 'dbr.googlemaps', 'address', '', 500, 600;

select name, name, 'svg-marker-#0056FF-#FFFFFF-#00AAFF', '', label
from stops
order by label;
You can extend the map with custom elements by defining a JavaScript function googleMapsExtend which myDBR will call and pass two parameters: map (map object) and index (if multiple maps are shown in single page):
select 'dbr.javascript', 'function googleMapsExtend(map, idx) {
  if (idx!=1) return;
  const flightPlanCoordinates = [
    { lat: 37.772, lng: -122.214 },
    { lat: 21.291, lng: -157.821 },
    { lat: -18.142, lng: 178.431 },
    { lat: -27.467, lng: 153.027 },
  ];
  const flightPath = new google.maps.Polyline({
    path: flightPlanCoordinates,
    geodesic: true,
    strokeColor: "#FF0000",
    strokeOpacity: 1.0,
    strokeWeight: 2,
  });

  flightPath.setMap(map);
}';