Commands
dbr.crosstab - Turn a table report into a cross-tabulation report. The first parameter is the crosstable column, the optional second parameter marks the last data column inside a crosstable.dbr.hsum - Calculate horizontal sum in a cross-tabulation reportdbr.hmin - Calculate horizontal minimum in a cross-tabulation reportdbr.hmax - Calculate horizontal maximum in a cross-tabulation reportdbr.hminus - Calculate horizontal value with formula Col1 - Col2 - Col3...dbr.hnull - Creates a placeholder for a horizontal column used with dbr.calcdbr.hcount - Calculate number of values horizontally in a cross-tabulation reportdbr.havg - Calculate horizontal average in a cross-tabulation reportdbr.hidecolumn.data - Allows hiding crosstable data columns, keep summary column. Used with dbr.calcdbr.hidecolumn.set.data - Allows hiding crosstable data columns based on data CrossTabSet namedbr.hidedatacolumn - Same as dbr.hidecolumn.data, kept for compatibilitydbr.hidecolumn.data.all - Hide all crosstable data columns, keep summary column.dbr.hidecolumn.summary - Allows hiding crosstable summary columns, keeping data columns. Used with dbr.calcdbr.crosstab.title - Redefine the default title for horizontal summary columndbr.crosstab.order - Set the order of the cross-tabulation columnsdbr.crosstab.col - Predefine the cross-tabulation columnsdbr.crosstab.options - Add crosstab optiondbr.crosstab.col.title - Set column title for crosstab horizontal summary columndbr.crosstab.col.style - Set columnstyle for crosstab horizontal summary columndbr.crosstab.header - Add additional header group in crosstabdbr.crosstab.header.col - Predefine the 2nd level cross-tabulation header columns defined in dbr.crosstab.headerdbr.crosstab.group - Group crosstable column values by adding another header leveldbr.crosstab.data.tooltip - Define a crosstab header tooltip based on the crosstab data value
Syntax
select 'dbr.crosstab', ColumnReference [, ColumnReference]
select 'dbr.hsum', ColumnReference, [ColumnReference... ]
select 'dbr.hmin', ColumnReference, [ColumnReference... ]
select 'dbr.hmax', ColumnReference, [ColumnReference... ]
select 'dbr.hminus', ColumnReference, [ColumnReference... ]
select 'dbr.hnull', ColumnReference, [ColumnReference... ]
select 'dbr.hcount', ColumnReference, [ColumnReference... ]
select 'dbr.havg', ColumnReference, [ColumnReference... ]
select 'dbr.hidecolumn.data', ColumnReference, [ColumnReference... ]
select 'dbr.hidecolumn.set.data', 'CrossTabSet', ColumnReference, [ColumnReference... ]
select 'dbr.hidedatacolumn', ColumnReference, [ColumnReference... ]
select 'dbr.hidecolumn.data.all' {, 1/0 }
select 'dbr.hidecolumn.summary', ColumnReference, [ColumnReference... ]
select 'dbr.crosstab.title', 'title'
select 'dbr.crosstab.order', 'asc'|'desc'
select 'dbr.crosstab.col', col_value1, [col_value2... ]
select 'dbr.crosstab.options', 'no_null_data' | 'summary_first'
select 'dbr.crosstab.col.title', ColumnReference, 'title'
select 'dbr.crosstab.col.style', ColumnReference, columnstyle
select 'dbr.crosstab.header', ColumnReference
select 'dbr.crosstab.header.col', col_value1, [col_value2... ]
select 'dbr.crosstab.group', 'crosstab_value', 'group_name'
select 'dbr.crosstab.data.tooltip', 'crosstab_data_value', 'tooltip'
Where:
- dbr.crosstab.options, option
-
Options for crosstab
-
no_null_dataThe 'no_null_data' option allows suppressing null crosstable column generated for example with LEFT JOIN -
summary_firstShows the horizontal summary columns before the data columns. Useful with large number of data columns.
-
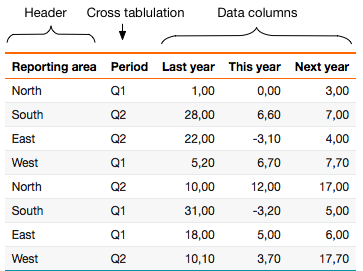
In the context of cross-tabulation, the data in the result set is organized into distinct header and data sections, separated by a designated cross-tabulation column. Header columns, positioned to the left of the cross-tabulation column, determine the unique rows within the final result set. On the right side of the cross-tabulation column, data columns—derived from the cross-tabulation—will be displayed. When using the dbr.crosstab command, you can specify a second parameter to include header columns on both sides of the cross-tabulation data columns.
Say we have basic data set:
select RepArea as 'Reporting area',
       Period,
       last_year as 'Last year',
       this_year as 'This year',
       next_year as 'Next year'
from mydb.ProductionSummary;
We can determine the different parts of the result set:
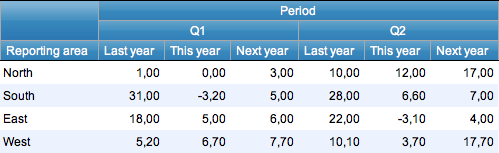
When designating the 'Period' column as a cross-tabulation column, the unique values within this column are computed as group columns, with corresponding data columns calculated beneath each respective group column.
/*
  Define the Period as a cross-tabulation column
*/
select 'dbr.crosstab', 'Period';

select RepArea as 'Reporting area',
       Period,
       last_year as 'Last year',
       this_year as 'This year',
       next_year as 'Next year'
from mydb.ProductionSummary;
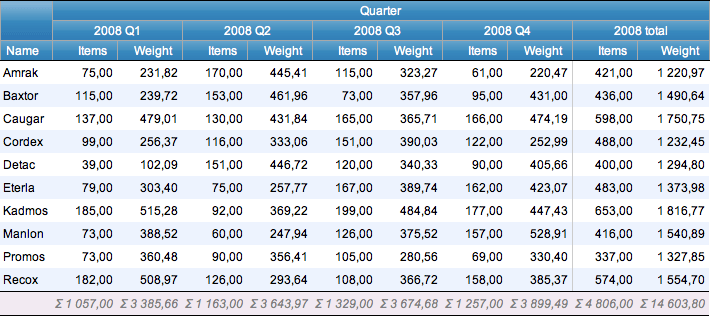
You can apply aggregate functions to both row and column values. For columns, use functions such as dbr.sum, dbr.min, dbr.max, dbr.avg, or dbr.count. For rows, employ dbr.hsum, dbr.hmin, or dbr.hmax.
myDBR streamlines the calculation process by performing computations on relevant columns and adding summary columns when necessary. If a data column is unnamed (set to an empty string), the corresponding header section will be hidden (refer to the example below).
select 'dbr.crosstab', 'Quarter';
select 'dbr.sum', 'Items','Weight';
select 'dbr.crosstab.title', '2008 total';
select 'dbr.hsum', 'Items','Weight';


select Name,
       concat(year(InsertDate), ' Q',quarter(InsertDate)) as 'Quarter',
       sum(Items) as 'Items',
       sum(Weight) as 'Weight'
from mydb.Production
group by Name, 2;
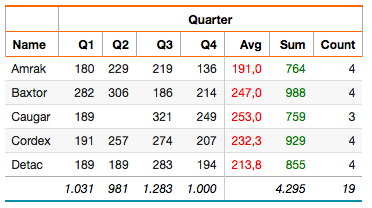
You can calculate multiple horizontal aggregates for a column by duplicating the column and hiding the data column. The data column refers to the repeated cross-tabulation data column. In the example, multiple horizontal aggregates are calculated and styled:
 /* Set titles for horizontal aggregate columns */
select 'dbr.crosstab.col.title', 'value',  'Avg';
select 'dbr.crosstab.col.title', 'sum',  'Sum';
select 'dbr.crosstab.col.title', 'count',  'Count';
/* Style the horizontal average column */
select 'dbr.crosstab.col.style', 'value', '[color:red]%.1f';
/* Style the horizontal sum column */
select 'dbr.crosstab.col.style', 'sum', '[color:green]';

select 'dbr.crosstab', 'Quarter';

/* Horizontal aggregates */
select 'dbr.havg', 'value';
select 'dbr.hsum', 'sum';
select 'dbr.hcount', 'count';

/* Show the sum and count columns only in the horizontal summary section */
select 'dbr.hidecolumn.data', 'sum';
select 'dbr.hidecolumn.data', 'count';

/* Vertical aggregates */
select 'dbr.sum', 'value';
select 'dbr.sum', 'sum';
select 'dbr.sum', 'count';

select
  Name,
  concat('Q',quarter(InsertDate)) as 'Quarter',
  sum(Items) as '[value]',
  sum(Items) as '[sum]',
  sum(Items) as '[count]'
from TestTable
group by Name, 2
order by Name, 2;
To define the order of existing cross-tabulation column headers, utilize the dbr.crosstab.order command.
select 'dbr.crosstab', 'Month';
select 'dbr.crosstab.order', 'asc';
select 'dbr.sum', 'value';
select 'dbr.hsum', 'value';

select Name,
       Month,
       Value as '[value]',
from mydb.monthlyvalues
order by Name;
If your data lacks certain cross-tabulation column headers that you wish to display in the report, employ the dbr.crosstab.col command.
Predefining the data columns allows you to specify which columns are displayed in the cross-tabulation report and in what order. This is particularly useful when you have a predefined set of cross-tabulation columns you want to include in the report (such as a series of months or fixed quarters) or when you wish to include columns that do not exist in the original data.
select 'dbr.crosstab', 'Month';
select 'dbr.sum', 'value';
select 'dbr.hsum', 'value';

select Name,
       Month,
       Value as '[value]',
from mydb.monthlyvalues
order by Name;
In this example, we'll generate a report with a monthly distribution. It's important to note that the data used in the example may not encompass all the months (1-12).
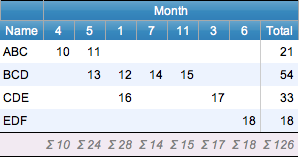
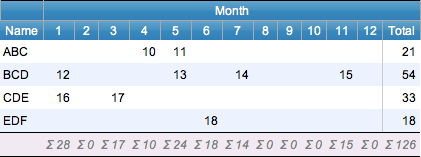
In this example, the months were derived from the fetched data, capturing both their order and actual values. However, if you need to explicitly define all the months (1-12) and specify the order of the columns, you can achieve this using the dbr.crosstab.col command.
select 'dbr.crosstab', 'Month';
select 'dbr.crosstab.col', 1,2,3,4,5,6,7,8,9,10,11,12;
select 'dbr.sum', 'value';
select 'dbr.hsum', 'value';

select Name,
       Month,
       Value as '[value]',
from mydb.monthlyvalues
order by Name;
Consequently, you will obtain a result in which all the months are explicitly defined and arranged in a logical order.
In cases where you have a dynamic number of columns (such as when the report parameter involves a date range), you can use the dbr.crosstab.col command multiple times. Each additional invocation of dbr.crosstab.col will contribute additional columns to the final report.
select 'dbr.crosstab', 'Month';
declare iMonth int;

set iMonth = 1;
while( iMonth <= inMonthParameter ) do
  select 'dbr.crosstab.col', iMonth;
  set iMonth = iMonth + 1;
end while;

select 'dbr.sum', 'value';
select 'dbr.hsum', 'value';

select Name,
       Month,
       Value as '[value]',
from mydb.monthlyvalues
order by Name;
If the report query generates data columns that are not explicitly defined in the predefined data columns, these additional columns will be appended to the end of the column list.
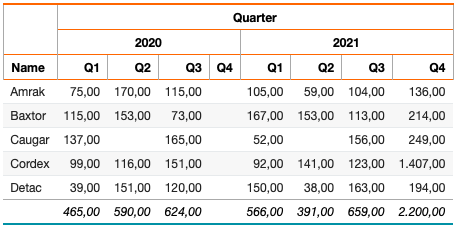
To introduce a second crosstab level based on the data, you can take the following steps:
select 'dbr.crosstab.header', 'Year';

select 'dbr.crosstab', 'Quarter', 'Items';
select 'dbr.sum', 'Items';

select
  Name,
  year(InsertDate) as 'Year',
  concat('Q',quarter(InsertDate)) as 'Quarter[Quarter]',
  sum(Items) as '[Items]
from data
group by Name, Year, 3
order by Name, Year, 3;
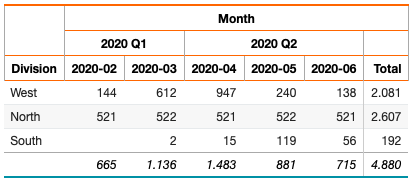
You can add a second crosstab level header row:
select distinct 'dbr.crosstab.group',
  date_format(InsertDate, '%Y-%m'),
  concat(date_format(concat(InsertDate,'-01'), '%Y Q'), QUARTER(concat(InsertDate,'-01'))) as 'Quarter'
from data;

select 'dbr.crosstab', 'Month';
select 'dbr.sum','Value';
select 'dbr.hsum','Value';

select Division, date_format(InsertDate, '%Y-%m') as 'Month', Value as '[Value]'
from data;
Linked reports can be attached to any column in the table, excluding the crosstab column. Any column is eligible to serve as a linked report parameter. If a linked report is attached to a crosstab's data column, the report will be generated for each repeated data item.
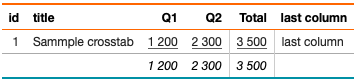
select 'dbr.report', 'sp_DBR_show_count', 'popup', '[value]', 'inID=id', 'inCnt=cnt';
select 'dbr.report', 'sp_DBR_show_count', 'popup', '[value.h]', 'inID=id',  'inCnt=cnt.h';

select 'dbr.crosstab', 'ct', 'cnt';
select 'dbr.sum','value';
select 'dbr.hsum','value';
select 'dbr.hsum','cnt';
select 'dbr.hidecolumn', 'cnt';


select
  1 as id,
  'Sammple crosstab' as title,
  'Q1' as  '[ct]',
  1200 as value,
  11 as cnt,
  'last column'
union
select
  1,
  'Sammple crosstab',
  'Q2',
  2300,
  12,
  'last column';
The report output
Internally the data looks like this (without the hidden 'cnt' column):
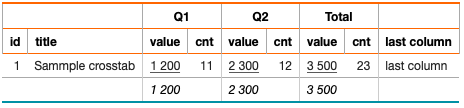
The initial linked report is associated with the value column, featuring two parameters: id and cnt. Since the id column precedes the repeated data columns, all instances of the inID parameter receive the same value, namely 1. Meanwhile, the cnt column resides within the data column sets, resulting in distinct values (11 for Q1 and 12 for Q2) for each set. For instance, when a user clicks on the value from Q2 (=2300), the database call is initiated with "sp_DBR_show_count(1, 12)".
The second linked report is linked to the horizontal summary column value.h. The reference cnt.h corresponds to the cnt value of 23 within the horizontal summary column. When a user clicks on the horizontal summary value (3500), the database call is triggered with "sp_DBR_show_count(1, 23)".
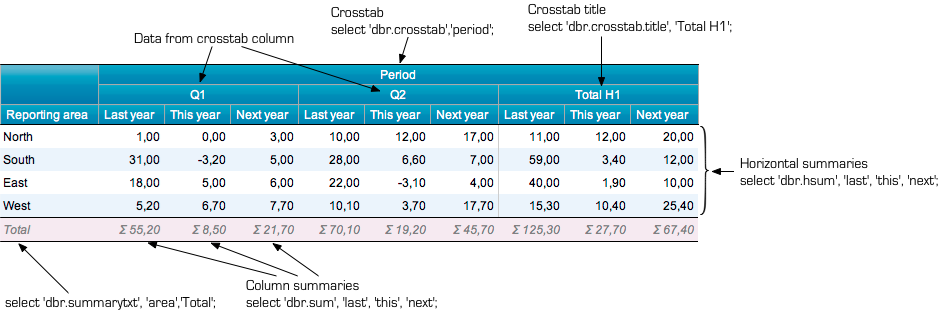
By designating the 'Period' column as a cross-tabulation column, the distinct values within the column are computed as group columns. Subsequently, the data columns are calculated beneath each respective group column.
/*
  Define the Period as a cross-tabulation column
  Add column and horizontal sums
  Name the crosstab column
*/
select 'dbr.crosstab', 'Period';
select 'dbr.sum', 'last', 'this', 'next';
select 'dbr.hsum', 'last', 'this', 'next';
select 'dbr.crosstab.title', 'Total H1';
select 'dbr.summary.text', 'area','Total';

select RepArea as 'Reporting area[area]',
       Period,
       last_year as 'Last year[last]',
       this_year as 'This year[this]',
       next_year as 'Next year[next]'
from mydb.ProductionSummary;
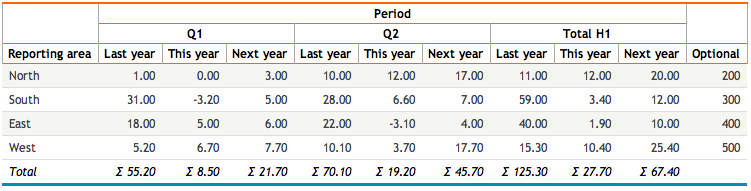
Upon specifying the 'Period' column as a cross-tabulation column, the unique values within the column are computed as group columns, with the corresponding data columns calculated beneath each group column.
/*
  Define the Period as a cross-tabulation column and 'next' column to be the last data column inside the cross-tabulation.
*/
select 'dbr.crosstab', 'Period', 'next';
select 'dbr.sum', 'last', 'this', 'next';
select 'dbr.hsum', 'last', 'this', 'next';
select 'dbr.crosstab.title', 'Total H1';
select 'dbr.summary.text', 'area','Total';

select RepArea as 'Reporting area[area]',
       Period,
       last_year as 'Last year[last]',
       this_year as 'This year[this]',
       next_year as 'Next year[next]'
       Optional
from mydb.ProductionSummary;
The 'no_null_data' option suppresses the generation of null crosstable columns, often produced by operations like LEFT JOIN. Although the row is displayed (if other rows contain data), the NULL column is omitted as a crosstab data column.
In the example, rows are created for each month, even if there is no specified rate for the hotel in that month. The 'no_null_data' option ensures that the NULL column, generated by the crosstab column 'name' due to the LEFT JOIN, is suppressed.
create temporary table d (
d date
);

insert into d values ('2016-01-01'),('2016-01-02'),('2016-01-03');
select 'dbr.crosstab', 'name';
select 'dbr.crosstab.options', 'no_null_data';

select d.d as 'Day', h.name as '[name]', h.rate as ''
from d d
  left join (
    select cast('2016-01-02' as date) as d, 'The Imprerial' as name, 680 as 'rate'
    from mydbr_version
  ) as h on h.d=d.d
order by d.d;